|
Learning to Use the ds9 Imaging System
Part 1: First Look Qualitative Analysis using ds9
A quick list of the basic techniques of x-ray analysis:
|
In this first section you will use ds9 to make and color an image, and to look at some features.
One of the great things about Chandra is that both of its x-ray detectors can record really good position information. Because of this, the first thing we typically want to do when studying an object using Chandra data is to look at an image of the object. We call this a "qualitative" look because we are asking you to notice characteristics of the data that you can see by eye, without doing any complex numerical (quantitative) analysis.
Don't underestimate the value of taking a qualitative look at new data: the human eye is a wonderful instrument that can pick up subtle features of data, providing invaluable insights into where to look further with more quantitative methods.
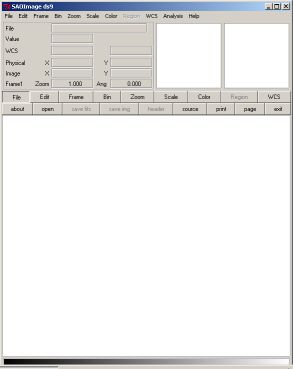
Loading the Cas-A image
 Enlarge Image |
|
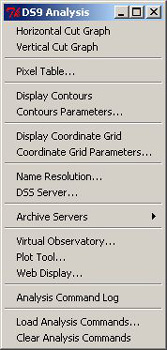 |
The DS9 Analysis window includes several quantitative analysis tools you will use at various times during the tutorial.
Choose the Virtual Observatory to access images from various sources. |
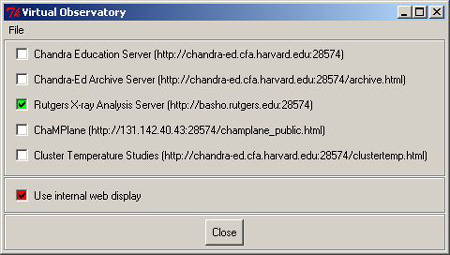 |
For this tutorial, you will need to open the Cas-A supernova remnant image which is located on the Rutgers X-ray Analysis Server.
Place a checkmark in the box to the left of the Rutgers server. |
 Enlarge Image |
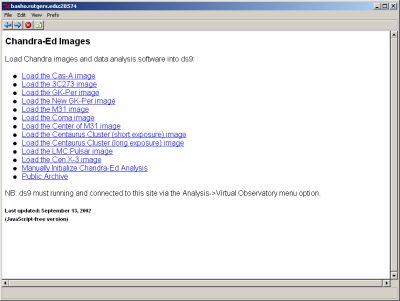
Load the Cas-A image from the list of images shown. |
 Enlarge Image |
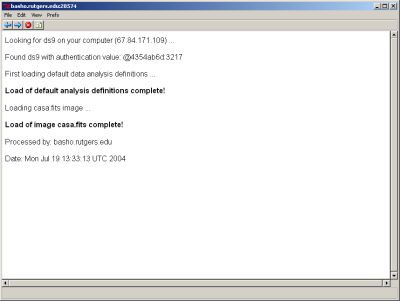
A window indicating that you have loaded the image of interest will appear.
Minimize this window so that you can load other images from the list at a later time. |
 Enlarge Image |
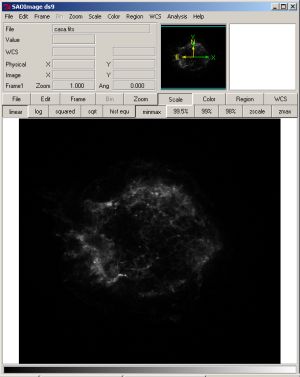
When you have successfully loaded the image of Cas-A the image will appear as it does here with the following default settings:
|
This the same Cas-A data set that you can load through the Activities and Images section. If the image does not load, check to make sure that you have:
- installed ds9
- started ds9 and
- connected to the Chandra analysis tools through the virtual observatory on the ds9 pulldown analysis menu.
You will want to follow the directions in this section while working primarily in the ds9 window. We suggest that you print this section and use the printout as your reference for working in the ds9 window.
Next: Looking at an X-ray image: Contrast and Bias
Last updated: