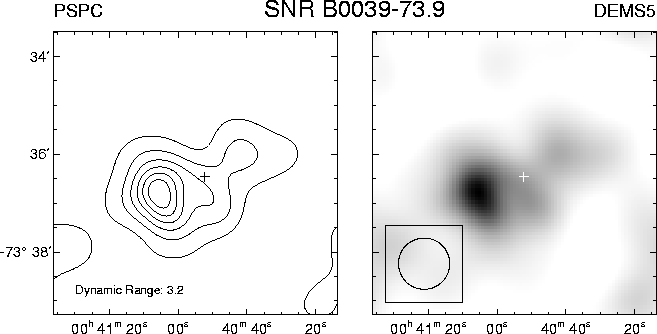
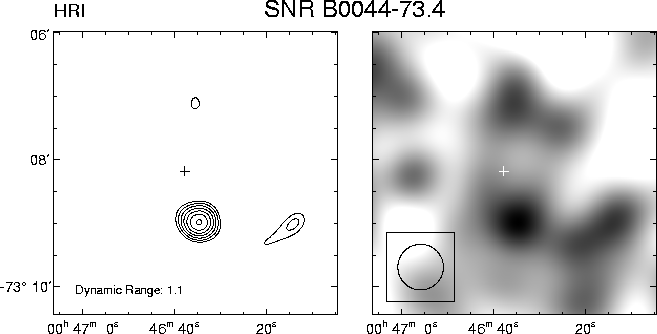
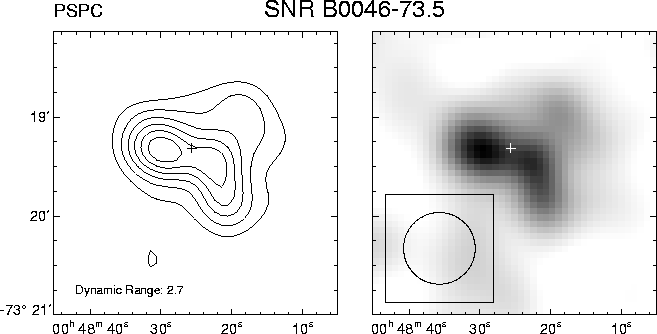
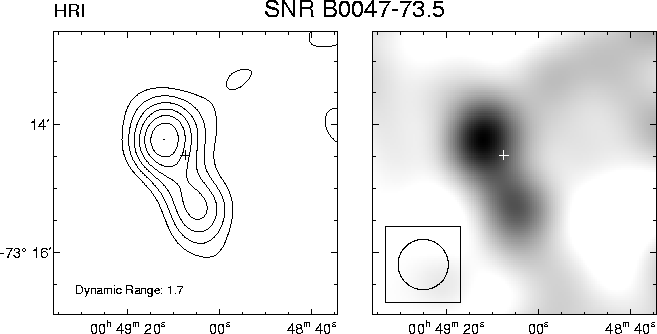
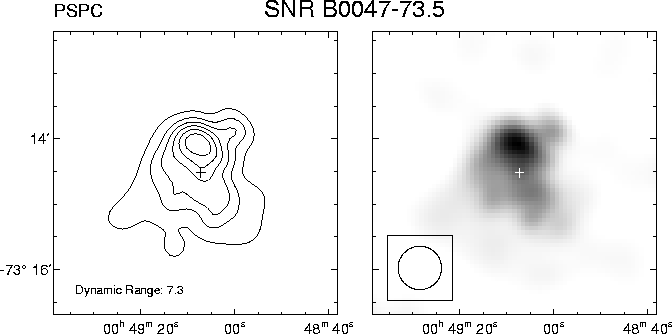
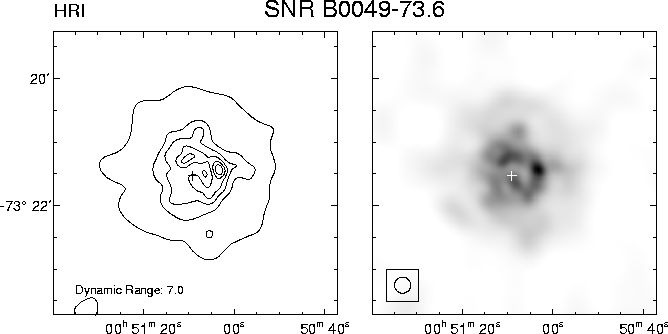
Contour and grayscale levels were chosen in an objective
manner. The background level was taken to be the mode of the pixel
values in the adaptively-smoothed image and the error on the
background was taken from the width of the pixel count distribution
about the mode. The minimum contour level plotted is 3-sigma above
background and there are five other contour levels plotted in equal
linear intervals between the minimum and the peak. The grayscale is
plotted from the background level to the peak value.
Please refer to this work as
Glikman E. & Hughes, J.P. 2002, 'A Catalog of ROSAT X-ray Images of Magellanic
Cloud Supernova Remnants,' Department of Physics and Astronomy, Rutgers University
(available on the World-Wide-Web at "http://www.physics.rutgers.edu/~jackph/science/MCSNRs_atlas.html").
SMC SNR 0039-73.9 (Filipovic et al. 1998)
- Adaptive Smoothing: signal-to-noise ratio per pixel of 6
|
|
|
Contours: Linear spacing
|
Grayscale: Linear mapping
|
|
Minimum: 0.001859 cts s-1 arcmin-2
|
Minimum: 0.001286 cts s-1 arcmin-2
|
|
|
Increment: 0.000676 cts s-1 arcmin-2
|
Peak: 0.005913 cts s-1 arcmin-2
|
Return to table
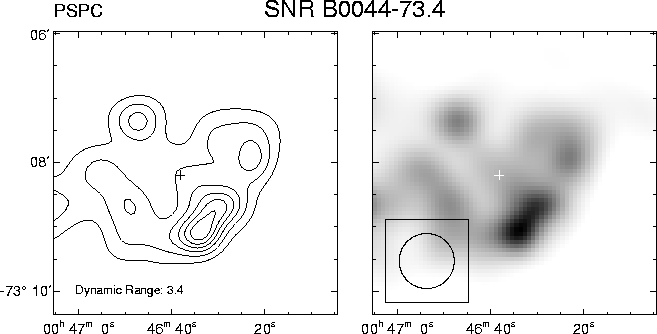
SMC SNR 0044-73.4 (Kahabka et al. 1999)
- Adaptive Smoothing: signal-to-noise ratio per pixel of 7
- Caveat! Not a significant detection
|
|
|
Contours: Linear spacing
|
Grayscale: Linear mapping
|
|
Minimum: 0.006347 cts s-1 arcmin-2
|
Minimum: 0.004555 cts s-1 arcmin-2
|
|
|
Increment: 0.000091 cts s-1 arcmin-2
|
Peak: 0.006924 cts s-1 arcmin-2
|
- Adaptive Smoothing: signal-to-noise ratio per pixel of 5
|
|
|
Contours: Linear spacing
|
Grayscale: Linear mapping
|
|
Minimum: 0.002586 cts s-1 arcmin-2
|
Minimum: 0.001510 cts s-1 arcmin-2
|
|
|
Increment: 0.00105 cts s-1 arcmin-2
|
Peak: 0.008880 cts s-1 arcmin-2
|
Return to table
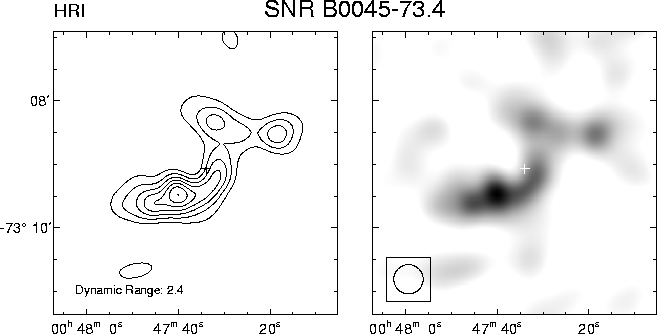
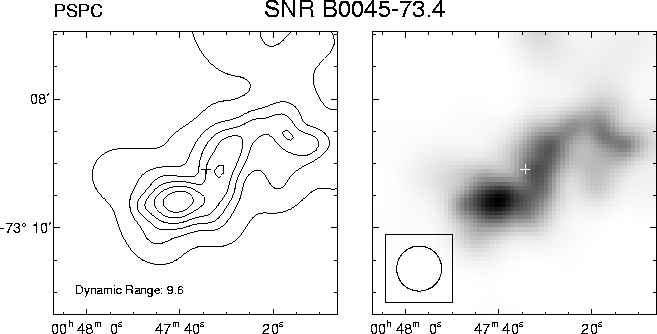
SMC SNR 0045-73.4 (Mathewson et al. 1983)
- Adaptive Smoothing: signal-to-noise ratio per pixel of 5
|
|
|
Contours: Linear spacing
|
Grayscale: Linear mapping
|
|
Minimum: 0.007289 cts s-1 arcmin-2
|
Minimum: 0.005467 cts s-1 arcmin-2
|
|
|
Increment: 0.001731 cts s-1 arcmin-2
|
Peak: 0.01765 cts s-1 arcmin-2
|
- Adaptive Smoothing: signal-to-noise ratio per pixel of 5
|
|
|
Contours: Linear spacing
|
Grayscale: Linear mapping
|
|
Minimum: 0.002416 cts s-1 arcmin-2
|
Minimum: 0.001329 cts s-1 arcmin-2
|
|
|
Increment: 0.003483 cts s-1 arcmin-2
|
Peak: 0.02332 cts s-1 arcmin-2
|
Return to table
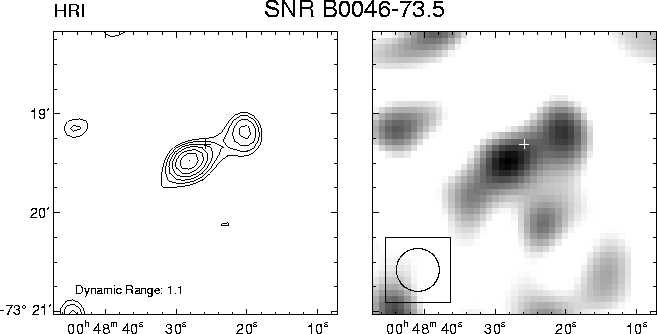
SMC SNR 0046-73.5 (Mathewson et al. 1983)
- Adaptive Smoothing: signal-to-noise ratio per pixel of 7
- Caveat! Not a significant detection
|
|
|
Contours: Linear spacing
|
Grayscale: Linear mapping
|
|
Minimum: 0.00704 cts s-1 arcmin-2
|
Minimum: 0.00574 cts s-1 arcmin-2
|
|
|
Increment: 0.000175 cts s-1 arcmin-2
|
Peak: 0.00809 cts s-1 arcmin-2
|
- Adaptive Smoothing: signal-to-noise ratio per pixel of 5
|
|
|
Contours: Linear spacing
|
Grayscale: Linear mapping
|
|
Minimum: 0.001978 cts s-1 arcmin-2
|
Minimum: 0.00123 cts s-1 arcmin-2
|
|
|
Increment: 0.000565 cts s-1 arcmin-2
|
Peak: 0.005368 cts s-1 arcmin-2
|
Return to table
SMC SNR 0047-73.5 (Mathewson et al. 1984)
- Adaptive Smoothing: signal-to-noise ratio per pixel of 8
|
|
|
Contours: Linear spacing
|
Grayscale: Linear mapping
|
|
Minimum: 0.005847 cts s-1 arcmin-2
|
Minimum: 0.004556 cts s-1 arcmin-2
|
|
|
Increment: 0.000639 cts s-1 arcmin-2
|
Peak: 0.00968 cts s-1 arcmin-2
|
- Adaptive Smoothing: signal-to-noise ratio per pixel of 4
|
|
|
Contours: Linear spacing
|
Grayscale: Linear mapping
|
|
Minimum: 0.002414 cts s-1 arcmin-2
|
Minimum: 0.001353 cts s-1 arcmin-2
|
|
|
Increment: 0.002553 cts s-1 arcmin-2
|
Peak: 0.01774 cts s-1 arcmin-2
|
Return to table
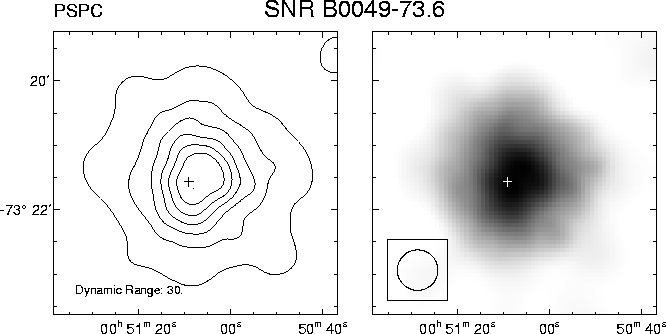
SMC SNR 0049-73.6 (Mathewson et al. 1983)
- Adaptive Smoothing: signal-to-noise ratio per pixel of 6
|
|
|
Contours: Linear spacing
|
Grayscale: Linear mapping
|
|
Minimum: 0.007395 cts s-1 arcmin-2
|
Minimum: 0.004845 cts s-1 arcmin-2
|
|
|
Increment: 0.007357 cts s-1 arcmin-2
|
Peak: 0.05155 cts s-1 arcmin-2
|
- Adaptive Smoothing: signal-to-noise ratio per pixel of 5
|
|
|
Contours: Linear spacing
|
Grayscale: Square-root mapping
|
|
Minimum: 0.002141 cts s-1 arcmin-2
|
Minimum: 0.001523 cts s-1 arcmin-2
|
|
|
Increment: 0.01022 cts s-1 arcmin-2
|
Peak: 0.06349 cts s-1 arcmin-2
|
Return to table
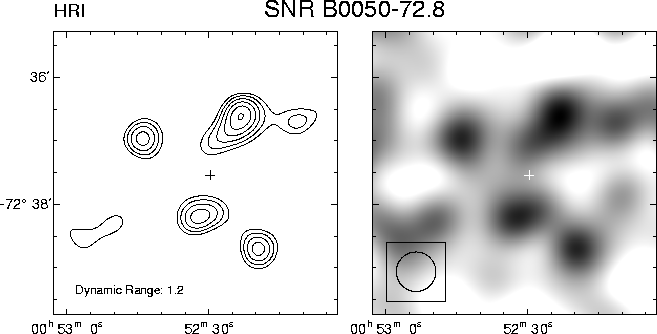
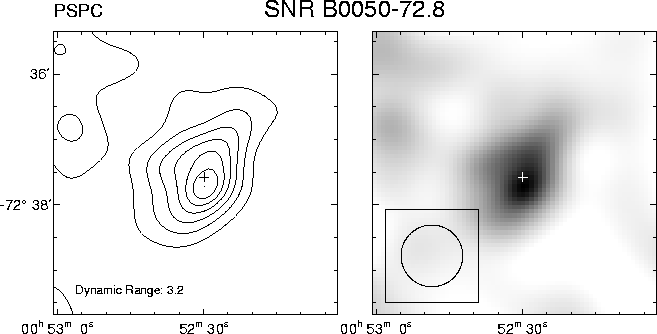
SMC SNR 0050-72.8 (Mathewson et al. 1984)
- Adaptive Smoothing: signal-to-noise ratio per pixel of 8
- Caveat! Not a significant detection
|
|
|
Contours: Linear spacing
|
Grayscale: Linear mapping
|
|
Minimum: 0.00621 cts s-1 arcmin-2
|
Minimum: 0.004706 cts s-1 arcmin-2
|
|
|
Increment: 0.000207 cts s-1 arcmin-2
|
Peak: 0.00749 cts s-1 arcmin-2
|
- Adaptive Smoothing: signal-to-noise ratio per pixel of 5
|
|
|
Contours: Linear spacing
|
Grayscale: Linear mapping
|
|
Minimum: 0.001907 cts s-1 arcmin-2
|
Minimum: 0.001315 cts s-1 arcmin-2
|
|
|
Increment: 0.000713 cts s-1 arcmin-2
|
Peak: 0.006187 cts s-1 arcmin-2
|
Return to table
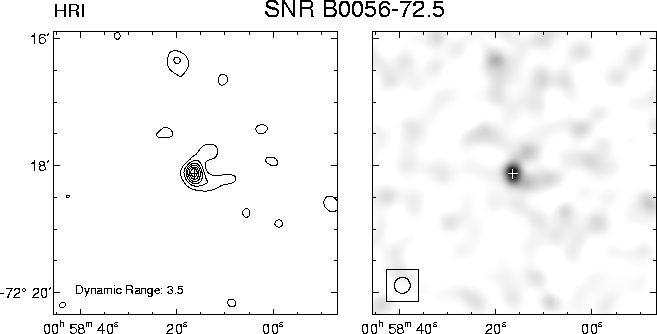
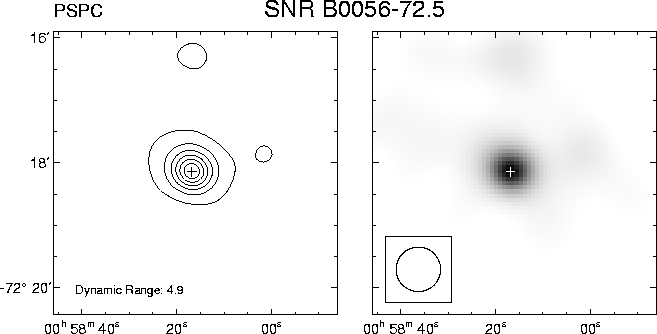
SMC SNR 0056-72.5 (Mathewson et al. 1984)
- Adaptive Smoothing: signal-to-noise ratio per pixel of 5
|
|
|
Contours: Linear spacing
|
Grayscale: Linear mapping
|
|
Minimum: 0.006539 cts s-1 arcmin-2
|
Minimum: 0.003995 cts s-1 arcmin-2
|
|
|
Increment: 0.00628 cts s-1 arcmin-2
|
Peak: 0.02265 cts s-1 arcmin-2
|
- Adaptive Smoothing: signal-to-noise ratio per pixel of 7
|
|
|
Contours: Linear spacing
|
Grayscale: Linear mapping
|
|
Minimum: 0.003473 cts s-1 arcmin-2
|
Minimum: 0.002226 cts s-1 arcmin-2
|
|
|
Increment: 0.002248 cts s-1 arcmin-2
|
Peak: 0.01696 cts s-1 arcmin-2
|
Return to table
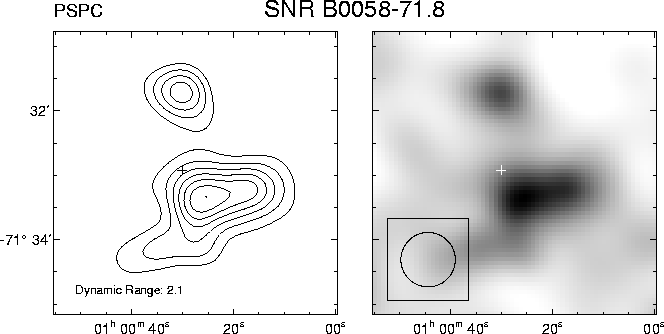
SMC SNR 0058-71.8 (Mathewson et al. 1984)
- Adaptive Smoothing: signal-to-noise ratio per pixel of 6
|
|
|
Contours: Linear spacing
|
Grayscale: Linear mapping
|
|
Minimum: 0.00247 cts s-1 arcmin-2
|
Minimum: 0.001378 cts s-1 arcmin-2
|
|
|
Increment: 0.000448 cts s-1 arcmin-2
|
Peak: 0.05159 cts s-1 arcmin-2
|
Return to table
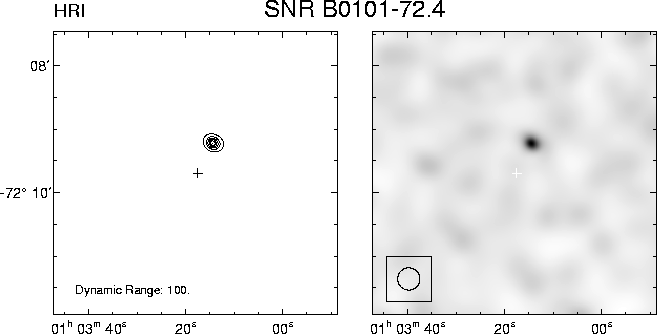
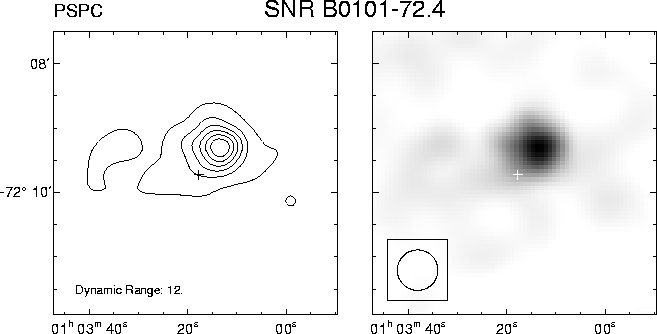
SMC SNR 0101-72.4 (Mathewson et al. 1983)
- Adaptive Smoothing: signal-to-noise ratio per pixel of 4
- X-ray point source
was identified with an mV = 14.8 Be star, see
Hughes
& Smith 1994, AJ, 107 1363.
- BeppoSax detected X-ray pulsations at 345.2 s (IAUC 6999)
- No significant detection of diffuse X-ray emission from the remnant.
|
|
|
Contours: Linear spacing
|
Grayscale: Square-root mapping
|
|
Minimum: 0.009075 cts s-1 arcmin-2
|
Minimum: 0.005704 cts s-1 arcmin-2
|
|
|
Increment: 0.0137 cts s-1 arcmin-2
|
Peak: 0.09108 cts s-1 arcmin-2
|
- Adaptive Smoothing: signal-to-noise ratio per pixel of 5
|
|
|
Contours: Linear spacing
|
Grayscale: Square-root mapping
|
|
Minimum: 0.002943 cts s-1 arcmin-2
|
Minimum: 0.0018 cts s-1 arcmin-2
|
|
|
Increment: 0.005278 cts s-1 arcmin-2
|
Peak: 0.03461 cts s-1 arcmin-2
|
Return to table
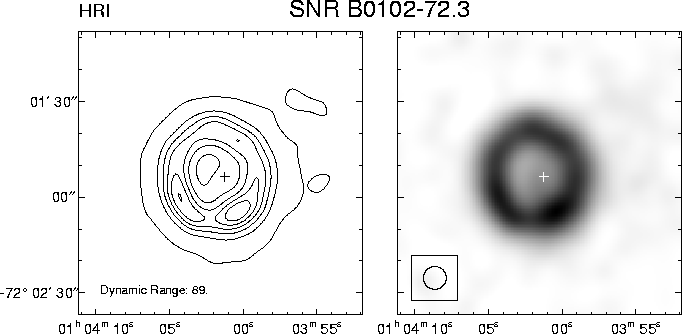
SMC SNR 0102-72.3 (Mathewson et al. 1983)
- Adaptive Smoothing: signal-to-noise ratio per pixel of 3
- Deconvolved using the LR algorithm for 3 iterations
|
|
|
Contours: Linear spacing
|
Grayscale: Square-root mapping
|
|
Minimum: 0.06011 cts s-1 arcmin-2
|
Minimum: 0.006011 cts s-1 arcmin-2
|
|
|
Increment: 0.9766 cts s-1 arcmin-2
|
Peak: 5.856 cts s-1 arcmin-2
|
Return to table
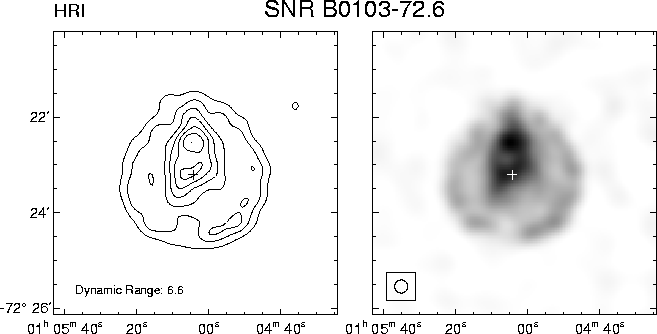
SMC SNR 0103-72.6 (Mathewson et al. 1983)
- Adaptive Smoothing: signal-to-noise ratio per pixel of 7
|
|
|
Contours: Linear spacing
|
Grayscale: Linear mapping
|
|
Minimum: 0.007341 cts s-1 arcmin-2
|
Minimum: 0.005139 cts s-1 arcmin-2
|
|
|
Increment: 0.007586 cts s-1 arcmin-2
|
Peak: 0.05286 cts s-1 arcmin-2
|
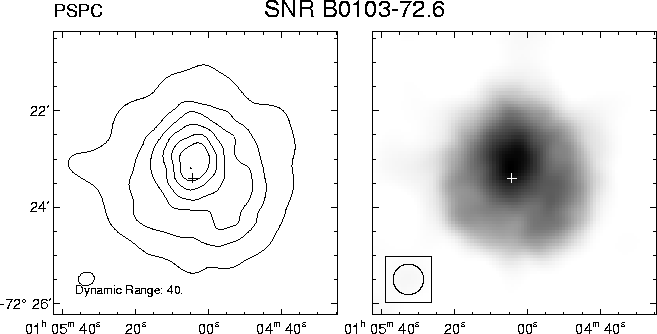
- Adaptive Smoothing: signal-to-noise ratio per pixel of 6
|
|
|
Contours: Linear spacing
|
Grayscale: Square-root mapping
|
|
Minimum: 0.002449 cts s-1 arcmin-2
|
Minimum: 0.001653 cts s-1 arcmin-2
|
|
|
Increment: 0.01592 cts s-1 arcmin-2
|
Peak: 0.09797 cts s-1 arcmin-2
|
Return to table
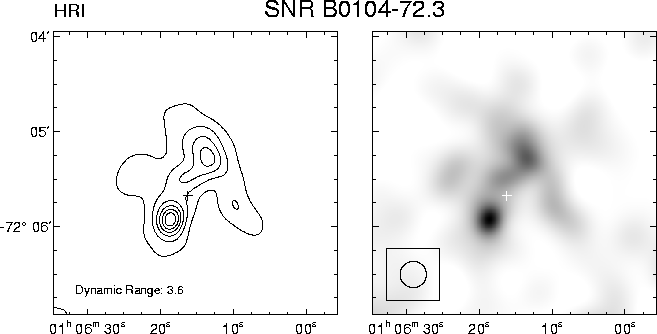
SMC SNR 0104-72.3 (Mathewson et al. 1984)
|
|
|
Contours: Linear spacing
|
Grayscale: Linear mapping
|
|
Minimum: 0.009352 cts s-1 arcmin-2
|
Minimum: 0.005477 cts s-1 arcmin-2
|
|
|
Increment: 0.004141 cts s-1 arcmin-2
|
Peak: 0.03405 cts s-1 arcmin-2
|
- Adaptive Smoothing: signal-to-noise ratio per pixel of 6
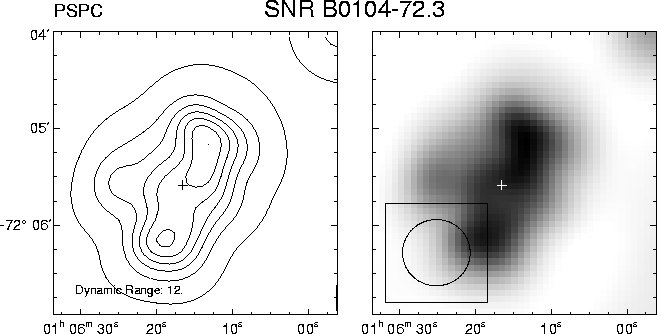
|
|
|
Contours: Linear spacing
|
Grayscale: Square-root mapping
|
|
Minimum: 0.002112 cts s-1 arcmin-2
|
Minimum: 0.001334 cts s-1 arcmin-2
|
|
|
Increment: 0.003435 cts s-1 arcmin-2
|
Peak: 0.02502 cts s-1 arcmin-2
|
Return to table
Revised September 10, 2002
Please send any comments on this page to Jack Hughes, jph@physics.rutgers.edu.
Copyright © 2002 John P. Hughes. All rights reserved.
