Name: Section:
Partner: Date:
Spring Constant, k: Measure and record the change in the spring's
length for each change in the added weight. Using MKS units, enter the
data in the table. Use Excel to plot ![]() versus
versus ![]() . Then
fit a straight line to your data. How will this fit tell you the value of
. Then
fit a straight line to your data. How will this fit tell you the value of
![]() ?
?
From a simple fit, ![]() (include units!)
(include units!)
SHM Period: Record the total mass and measured period below:
Total Mass = Period,
![]()
Now calculate the theoretical period from your measurement of ![]() and the mass.
Compare the theoretical and measured values.
and the mass.
Compare the theoretical and measured values.
Period,
![]() Ratio,
Ratio,
![]()
Equation 6 assumes the spring is massless. In fact, we should add 1/3 the mass
of the spring to ![]() . Take the spring mass to be 30 g. Does this improve the
agreement?
. Take the spring mass to be 30 g. Does this improve the
agreement?
Period,
![]() Ratio,
Ratio,
![]()
Displacement/Velocity Magnitude Relationship: Pick any convenient
time on the displacement and velocity graphs, record the values of ![]() ,
, ![]() and
and ![]() plus the value of
plus the value of ![]() . Substitute your measured values of
. Substitute your measured values of ![]() ,
, ![]() and
and ![]() into Eqn. (3) to obtain a predicted velocity. Compare this with
the measured velocity
into Eqn. (3) to obtain a predicted velocity. Compare this with
the measured velocity
![]() ,
, ![]() ,
,
![]() ,
, ![]() .
.
![]() (show work here)
(show work here)
![]()
Displacement/Velocity/Acceleration Phase Relationships:
From your pairs of graphs for displacement-velocity and
displacement-acceleration, it is obvious that they are all
sinusoidal curves. We want to know their phase relationship or
relative phase shift. Example: if the maximum peaks coincide, they
are in phase; the phase shift, ![]() is 0 radians or
is 0 radians or
![]() . If the maximum peaks correspond to the minimum of another
they are shifted by
. If the maximum peaks correspond to the minimum of another
they are shifted by
![]() .
.
Record the time of the peaks for distance (displacement) and
velocity. Select the first displacement peak, record its time.
Then find the closest velocity peak and record its time. Repeat
this for the next pair of peaks. Use the period to calculate
the phase relationship, ![]() in degrees.
in degrees.
| Peak pair #1 | Peak pair #2 | Peak pair #3 | |
| Time of Displacement Max. | |||
| Time of Velocity Max. | |||
|
|
Determine the average
![]()
Does the velocity lead or lag the displacement, i.e., does it reach its peak
value before or after the (nearest) displacement peak?
Do the same analysis for displacement and acceleration.
| Peak pair #1 | Peak pair #2 | Peak pair #3 | |
| Time of Displacement Max. | |||
| Time of Acceleration Max. | |||
|
|
Determine the average
![]()
Does the acceleration lead or lag the displacement?
From your analysis complete the following table. For each case, answer whether the displacement, X, is a negative maximum, at 0, or a positive maximum.
| Case | Displacement (Neg. maximum, 0, or Pos. maximum?) |
| Velocity is positive maximum | X is |
| Velocity is 0 | X is |
| Velocity is negative maximum | X is |
| Acceleration is positive maximum | X is |
| Acceleration is 0 | X is |
| Acceleration is negative maximum | X is |
Mass and Amplitude Effects on the Period: Go back and measure the period for several values of the mass. Record your data. Compare your measurements with the theoretical value from Eqn. (5).
Measure the period for several amplitudes without changing the mass. Is there any change in the period? What is the theoretical period for your setup?
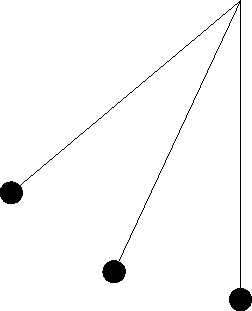
Interactive Physics Simulation of The Simple Pendulum
Dependence of Period on Mass, Gravity, and Length.
Use the simulation to verify Eqn. (12). To vary the mass click on the
circle, choose Properties from the Window menu and type a new value for
the mass in the appropriate box. To vary the value of ![]() , choose Gravity
from the World menu and type in a new value for
, choose Gravity
from the World menu and type in a new value for ![]() . To vary the length of
the pendulum, click on the rod and type in a new value in the properties box.
Measure the period by recording the difference in times between when
. To vary the length of
the pendulum, click on the rod and type in a new value in the properties box.
Measure the period by recording the difference in times between when ![]() . (Be careful, it's easy to make a mistake here!)
. (Be careful, it's easy to make a mistake here!)
| Mass (kg) | Length (m) | Measured Period (s) | Predicted Period (s) (eqn. 12) | |
| 50 | 9.8 | 3 | ||
| 0.5 | 39.2 | 3 | ||
| 0.5 | 2.45 | 3 | ||
| 0.5 | 9.8 | 12 | ||
| 0.5 | 9.8 | 0.75 | ||
| 0.5 | 9.8 | 3 |
Dependence of Period on Amplitude (Starting Angle)
Eqn. (12) was derived assuming the amplitude of oscillation was small so
that we can make the approximation
![]() . Use your
simulation to see under what conditions this approximation is true.
To change the starting angle, calculate the appropriate x or y value and
enter it under properties. (The simulation does not calculate
. Use your
simulation to see under what conditions this approximation is true.
To change the starting angle, calculate the appropriate x or y value and
enter it under properties. (The simulation does not calculate ![]() , so
you will have to calculate the initial x or y coordinates, i.e.,
, so
you will have to calculate the initial x or y coordinates, i.e., ![]() and
and
![]() , of the circle). In the last column of the table compute the ratio
of the period value you found from the simulation to the period of a
simple pendulum (small angle approximation). Write that value here:
, of the circle). In the last column of the table compute the ratio
of the period value you found from the simulation to the period of a
simple pendulum (small angle approximation). Write that value here:
Period,
![]()
What is the largest starting angle for which the measured period will
agree with the small angle period within 1% (find where ![]() differs from
differs from ![]() by 1%)?
by 1%)?
Acceleration
Predict the direction of the acceleration of the mass by drawing an arrow on the each of the circles below which represent the starting point of the pendulum, a point half way down, and the bottom of the swing.
Now check your predictions by choosing the acceleration vector under the Define menu. This will place the acceleration vector on the circle during the simulation. Explain why the acceleration points in the direction it does for each of the three cases