Name:
Section:
Partner: Date:
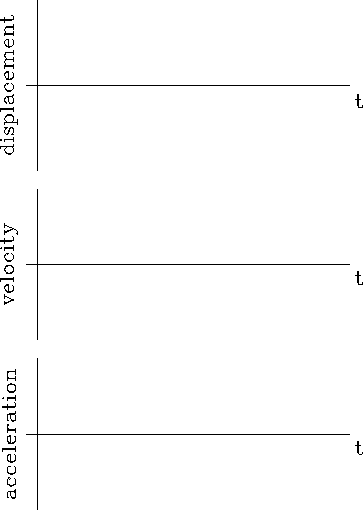
PURPOSE: To understand the graphical relationships between displacement, velocity and acceleration: slopes and derivatives, areas and integrals.
APPARATUS: PC, Universal Lab Interface, ultrasonic ranger, balls
PROCEDURE: In this lab you will use a computer program, LoggerPro to analyze the one-dimensional motion of a bouncing ball.
Part I: Adjust the settings for LoggerPro so that a
plot of displacement vs. time will be displayed on the computer
screen. Set the calibration of the distance probe (ranger) so that
distance away is negative and make an offset about ![]() m, such that
the floor level is registered as about zero. Set the data collection
rate to 40 Hz, and averaging to 7 points. Start by taking data for a
bouncing golf ball using the Sonic Ranger. Drop the ball from the
height of the table on which the ranger stand rests. REMEMBER: You are
studying one dimensional motion so the ball must be bouncing
vertically under the ranger. Do not let the ball get any
closer than 1/2 m from the ranger or it will not function properly.
You will need to get at least two good bounces in your data. Be sure
that LoggerPro is set so that up is the positive direction. When
you are satisfied with your data, transfer it from DATA A to DATA B
(this prevents it from being lost if you restart data taking).
m, such that
the floor level is registered as about zero. Set the data collection
rate to 40 Hz, and averaging to 7 points. Start by taking data for a
bouncing golf ball using the Sonic Ranger. Drop the ball from the
height of the table on which the ranger stand rests. REMEMBER: You are
studying one dimensional motion so the ball must be bouncing
vertically under the ranger. Do not let the ball get any
closer than 1/2 m from the ranger or it will not function properly.
You will need to get at least two good bounces in your data. Be sure
that LoggerPro is set so that up is the positive direction. When
you are satisfied with your data, transfer it from DATA A to DATA B
(this prevents it from being lost if you restart data taking).
U:
T:
D:
What about your velocity graph shows that the motion was away from the detector?
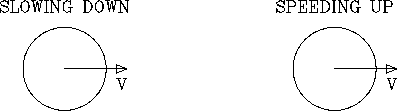
What about your velocity graph shows that the ball was speeding up? How would a graph of motion with a constant velocity differ?
Is the acceleration positive or negative when the ball is speeding up? What is the sign of the velocity while the ball is speeding up? What can you conclude about the relationship between the directions of the velocity and acceleration vectors when the ball is speeding up?
What about your velocity graph shows that the motion was toward the detector?
What about your velocity graph shows that the ball was slowing down. Is the acceleration positive or negative when the ball is slowing down? What is the sign of the velocity while the ball is slowing down? What can you conclude about the relationship between the directions of the velocity and acceleration vectors when the ball is slowing down?
Is the acceleration at this point positive, negative or zero?
Explain the observed sign of the acceleration at T. (Hint: is the ball slowing down or speeding up just before it reaches the top? Just after? What are the directions of the velocity vector at these times?)
Part II. Now you will be using the LoggerPro analysis tools to analyze your data.
Tangent at U Tangent at T
Tangent at D
In what units are these slopes expressed?
What does the slope correspond to physically?
Compare your results to the accompanying velocity data. Do they agree?
Tangent at U Tangent at T
Tangent at D
In what units are these slopes expressed?
What does the slope correspond to physically? Compare the measured slopes with the textbook value for the acceleration of gravity.
Compare your results to the data on the acceleration vs. time graph. Do they agree?
![]()
![]()
area under curve =
What are the units of this ``area''? What does this area correspond to physically?
Compare your results to the distance data, do they agree?
What would you expect this ``area'' to be equal to for the entire bounce? Explain and check your prediction.
![]()
![]()
area under curve =
What are the units of this ``area''? What does this area correspond to physically?
Compare your results to the velocity data, do they agree?
Part III. Set up an Excel spreadsheet to calculate
displacement vs. time for the golf ball for the time interval between
the first and second bounces. Rather than use the standard kinematic
formulae for constant acceleration, you should perform a numerical
integration. Begin at a point after the bounce when the calculated
acceleration is about
![]() (i.e., after the
averaging no longer includes points before the bounce) and end before
the next bounce before the acceleration starts changing to
positive. Copy the appropriate golf ball data from LoggerPro and
paste it into the spreadsheet. In the first row set the calculated
position and velocity to the actual values. The new velocity can be
approximated by
(i.e., after the
averaging no longer includes points before the bounce) and end before
the next bounce before the acceleration starts changing to
positive. Copy the appropriate golf ball data from LoggerPro and
paste it into the spreadsheet. In the first row set the calculated
position and velocity to the actual values. The new velocity can be
approximated by
![]() . The new position is then
. The new position is then
![]() . These formulae can be copied down to
give the velocity and position at later times. Use Excel to
plot the displacement vs. time data and your calculation on the same
graph. Print this graph for your report. Discuss the agreement or
disagreement between the two curves.
. These formulae can be copied down to
give the velocity and position at later times. Use Excel to
plot the displacement vs. time data and your calculation on the same
graph. Print this graph for your report. Discuss the agreement or
disagreement between the two curves.
Part IV. Take one coffee filter and let it drop under
the motion detector. You should find that very quickly the velocity
becomes nearly constant, i.e., it reaches terminal velocity.
Record this velocity. Repeat for 2, 3, and 4 filters stacked
together. Plot mass (in units of coffee filters, i.e., one
filter has mass = 1) vs. terminal velocity. Assume this is described by
the relationship
![]() . What is your best estimate
for
. What is your best estimate
for ![]() (assume
(assume ![]() is an integer)? Does the fact that terminal
velocity increases with mass mean that air resistance decreases for a
more massive object? Why don't you see much effect from air resistance
for the golf ball? For your report, type a paragraph or two in which
you describe the experiment and which includes the answers to the
above questions.
is an integer)? Does the fact that terminal
velocity increases with mass mean that air resistance decreases for a
more massive object? Why don't you see much effect from air resistance
for the golf ball? For your report, type a paragraph or two in which
you describe the experiment and which includes the answers to the
above questions.
Part V. Optional You may find it
interesting to do the following much more challenging calculation:
Your calculation in Part III assumes that the acceleration is
constant. If there is drag - friction due to the air - the
acceleration isn't constant. Stokes' Law tells us the drag force is
proportional to the velocity (provided the velocity isn't too large).
Then by Newton's Second Law, the acceleration is also proportional to
the velocity. Calculate the displacement vs. time assuming that ![]() where
where ![]() is a constant. Plot on one graph the displacement
vs. time curves for the two cases - drag and no drag. Explore the
effect of changing the value of
is a constant. Plot on one graph the displacement
vs. time curves for the two cases - drag and no drag. Explore the
effect of changing the value of ![]() . For your report print one graph
using a large enough value for
. For your report print one graph
using a large enough value for ![]() that you can see a difference. Be
careful. The equations you used in Part III cannot be used directly
since the acceleration is not constant. You can easily perform a
numerical integration of the equations using a spread sheet, using the
same equations you used before, but now acceleration will need to be
modified each time as well. Once you've done it for drag proportional
to
that you can see a difference. Be
careful. The equations you used in Part III cannot be used directly
since the acceleration is not constant. You can easily perform a
numerical integration of the equations using a spread sheet, using the
same equations you used before, but now acceleration will need to be
modified each time as well. Once you've done it for drag proportional
to ![]() , try it for drag proportional to
, try it for drag proportional to ![]() . Plot the different
cases.
. Plot the different
cases.